Data Visualization and Reporting
To simplify
complex stories and ideas, some Analysts or reporters tend to explain and make
repots in different formats. Converting data to graphical or pictorial format is
a simple definition of data visualization. One of the aim of visualize data is
to analyze the data and make it meaningful. In fact, Data carries a lot of
information that could takes time to read and understand especially statistics
information. Visualize data’s job is to make the raw information easy to read,
understand, and gives the users the summaries of the reports. There are various
formats to visualize data, such as bar chart, pie chart, flow/process chart, line
graph etc. (Few,Perceptual Edge-Selecting the Right Graph for Your Message). (According to Tuft's presentation ) the perfect statistical graphs
are results of sophisticated thoughts that display in accurate, clarity and
effectively way. As a result, visualizing data should be a better replace of
written data. In addition, graphs should represent a lot of numbers in a small
space in the report. Also, graphs prevent confusing the reader by clarifying
the ideas and numbers. In addition, the reader can easily compare between
pieces of data. As in (Gentile, B. The Top 5 Business Benefits of Using Data Visualization) blog, there are many benefits in using
data visualization such as in helping readers to comprehend the invisible data easily.
By visualizing data in Maps, graphs or charts users can take in a lot of
information in effective and efficient way. Data visualization illustrate many
valuable information; for example, a heat map can show the most and least selling
products, so business leader can go through that data and identify the reasons which
effect on the sales. Decision makers can observe the changing in marketing
environment and customers' behavior among huge amount of data. Thus, data visualization
is a successful method because it can help to improve sales and test the
customer needs.
·
Brief
history of data visualization
It might be
prevalent that data visualization and statistical graphs are modern approaches.
Indeed, they have been existed from ancient times (Friendly, M. A Brief History of Data Visualization ).
In 6200 b.C.
the oldest map was found in the region of Kirkuk, Iraq which is the description
of a city in Babylon.

Figure1: the oldest map
In the 2nd
century, Egypt created a table to arrange astronomical information to use as a
navigation. The table is basically represented set of rows and columns which
organize written data. In addition, tables are considered as a type of charts (Few, S. Data Visualization Past, Present, and Future)
(According to Friendly) up to the 17th century, data visualization expanded to
use new tools with accurate format in representing data. For example, timeline was uses to display the
life of some famous people in 1765.

Figure 2: Timeline
In 18th
century, modern graphs took place. Most of modern forms of graphs and charts
that known today were improvement from that century such as pie charts, weather
maps and geological map.
Representing
data in advanced statistical graphs and drawing charts become more recognizable
during the 19th century which is as Friendly says “ the modern age
of statistical graphs” (Friendly, M Milestones in the History of Data Visualization).
·
Modern
approaches of data visualization
There are several
ways to visualize data such as histograms, geographical map etc. On the hand,
there are modern methods like mind map which represent for example the most
well-known websites, and it shows the most popularity, succeed website Also,
Mind maps shoes how are these websites connected to each other (Friedman, V. Data Visualization: Modern Approaches ).
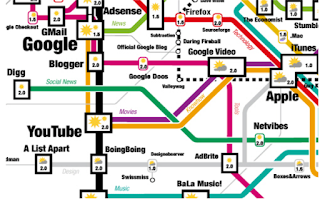
Figure3: Mind Map of the most popular websites
All in all, reporting data
and visualizing it are existing to clarify and simplify the complicated
stories. It has been there before the common era and it has been developed
through centuries.


Very clear explanation of date visualization.
ReplyDelete