What is Tableau
Software?
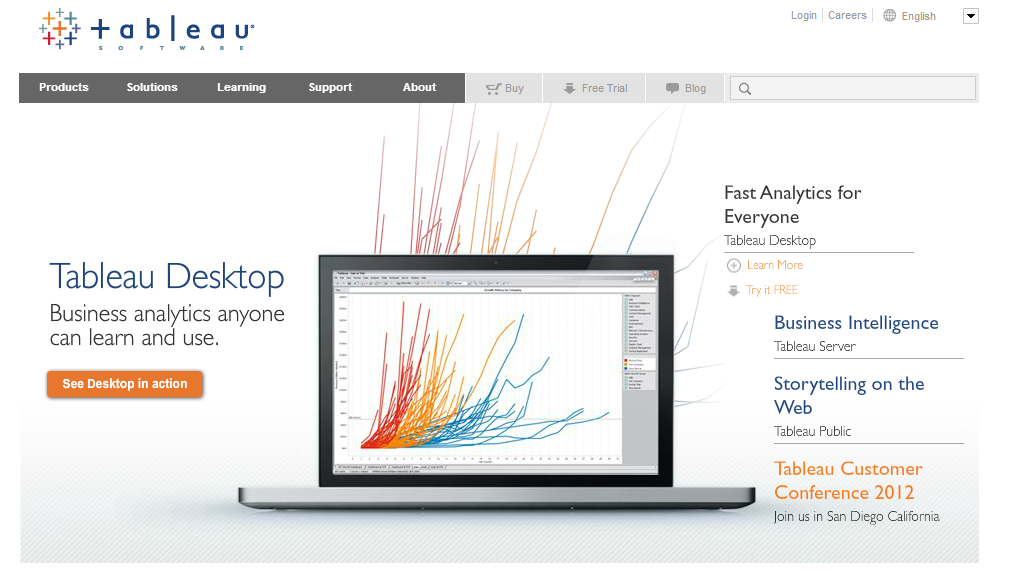
Tableau is data
analysis software that helps people observe and understand their data.
Tableau is one
of the data visualization desk top application that give users the ability to analyzes
any type of structured data and produce highly interactive dashboards, graphs
and reports in few minutes so the users as a result can draw a conclusion via
some visualizing data.
Some features
of Tableau software:
1-
Ease
of use. without programing just insight, users can analyze data by drag and
drop.
2-
Fast
Analytics. Visualizing data in few minutes
3-
Smart
dashboard. It involves multiple views of data in order to give a rich vision
4-
Update
automatically. Users have the option either to set an update schedule or they
can get an automatic update.
5-
Share
in few seconds. Users can publish dashboards by few clicks and share it on web
or any mobile devices.
By using
Tableau Reader which free viewing that anyone can read and interact with
package work books that crated by Tableau desktop. And by using Tableau
software, users can answer effectively any businesses questions by just drag
and drop data into a free form visual canvas. Users can analyze, filter, query
, graph, sort, calculate organize , summarize and present data more faster and
in efficient way by using views.
Supply chain
Analysis and Tableau
I wrote about supply chain Analytics in
my blog, and how data and analytics are important for efficient supply chain
process.
Organizations need
to realize the value of data by transforming their data into valuable
information, get clear vision and knowledge. Organizations will be able to make
accurate decisions.
By using
Tableau software within supply chain organizations. They have been able to
identify inventory reduction opportunities of up to 40%
These
organizations reach to four steps to the edge from supply chain data and
analytics:
1-
Reveal:
to analyze all parts of the supply chain. Organizations needs to import,
cleanup and visualize supply chain.
2-
Diagnose:
by using Tableau (dashboards), organizations can easily identify problems areas
and solve it in efficient way.
3-
Model:
compare supply chain policies and performance by stimulate process
improvements.
4-
Track:
set target plane of improvements.
To sum up, Tableau
gives the organizations the ability to discover data, analyze it and create
dashboard. Tableau software helps in analyzing supply chain by integrate data
to reveal crucial problems and opportunities. Moreover, it helps in analyze
shipping scheduling, inventory planning and transportation will be improved,
delivery metrics will track in time.


My favorite tool for analysis data is Tableau; it has a simple interface. Thank you for this information.
ReplyDelete