Saturday, April 29, 2017

Data Analytics Tools - IBM Watson


There are many data analytics tools. In my previous post, I wrote briefly about Tableau Software. In this post, I will summarize other type of data analytics tools which is IBM Watson. IBM Watson built to deal with huge amount of data. It also built to be as question answering machine and it has the ability to understand the natural language which lead to create more natural relationship between humans and computers. Watson create a response by depending on generating hypothesis and evaluation. Watson understands the knowledge of the data and applies it to the problem, alternative solutions provided and underlying evidence to support each alternative. “Watson has a unique feature which is the ability to learn a repeated use”. By tracking users feedback and from its success and failures, Watson become more smarting and presenting new information. Watson is not a replacement of human experts it is a supportive system to help creating decisions out of huge volume of unstructured data.

IBM Watson has a lot of advantages such as:

-          Ability to deal with massive quantities of data

-          For making decisions, it acts as a supportive system and improve performance

-          Ability to process unstructured data  

Some limitations that IBM Watson has that:

-          It is only available in English language

-          It processes structured data indirectly

-          With limited sources, Watson increases the rate of data

-          It is costly system which targeting only big organizations

IBM Watson implements in different fields such as:

-          Healthcare: Watson is used at M.D. Anderson Cancer Center in Houston to help them diagnose and develop treatments for patients through searching in database which include doctors’ notes and other medical papers.

-          Non-profits: by using natural language founders and donors has the opportunity to ask Watson questions and receive instant answers.
To read more about IBM Watson click here
Wednesday, April 26, 2017

Data Analytics Tools - Tableau Software


What is Tableau Software?

Tableau is data analysis software that helps people observe and understand their data.
Tableau is one of the data visualization desk top application that give users the ability to analyzes any type of structured data and produce highly interactive dashboards, graphs and reports in few minutes so the users as a result can draw a conclusion via some visualizing data.
Some features of Tableau software:
1-     Ease of use. without programing just insight, users can analyze data by drag and drop.
2-     Fast Analytics. Visualizing data in few minutes
3-     Smart dashboard. It involves multiple views of data in order to give a rich vision
4-     Update automatically. Users have the option either to set an update schedule or they can get an automatic update.
5-     Share in few seconds. Users can publish dashboards by few clicks and share it on web or any mobile devices.
By using Tableau Reader which free viewing that anyone can read and interact with package work books that crated by Tableau desktop. And by using Tableau software, users can answer effectively any businesses questions by just drag and drop data into a free form visual canvas. Users can analyze, filter, query , graph, sort, calculate organize , summarize and present data more faster and in efficient way by using views.
Supply chain Analysis and Tableau
I wrote about supply chain Analytics in my blog, and how data and analytics are important for efficient supply chain process.
Organizations need to realize the value of data by transforming their data into valuable information, get clear vision and knowledge. Organizations will be able to make accurate decisions.

By using Tableau software within supply chain organizations. They have been able to identify inventory reduction opportunities of up to 40%
These organizations reach to four steps to the edge from supply chain data and analytics:
1-     Reveal: to analyze all parts of the supply chain. Organizations needs to import, cleanup and visualize supply chain.
2-     Diagnose: by using Tableau (dashboards), organizations can easily identify problems areas and solve it in efficient way.
3-     Model: compare supply chain policies and performance by stimulate process improvements.
4-     Track: set target plane of improvements.
To sum up, Tableau gives the organizations the ability to discover data, analyze it and create dashboard. Tableau software helps in analyzing supply chain by integrate data to reveal crucial problems and opportunities. Moreover, it helps in analyze shipping scheduling, inventory planning and transportation will be improved, delivery metrics will track in time.

Data Analysis Overview


What is data analysis?
Data analysis refer to the process of converting large amount of raw unstructured or unorganized data and usually comes from different sources.
There is a range of data analysis which is correlated to the type of data being examined:
Determining employee performance, Sales performance by sales (person or department) are the concentration of some businesses. However, economic experts might look for different patterns that explain the spend habits of the consumers.
What are the types of data analysis?
There are various types of data analysis. It all depends on the nature of data that we are going to analyze. In general, there are two categories of data analysis: qualitative analysis and quantitative analysis.
-          Qualitative Analysis:
It is analyzing data by its categories which is usually from descriptive content such as text.
Data can be collected by different ways for instant, interviews, audio recording, videos, etc. After collecting data, it need to be interpreted by (coding) which is categorizing data into different themes then gives each them unique label. Data must be interpreted; however, coding is not the only way to interpret data.
       “According to (Seidel, 1998) qualitative analysis summarized in three principals: notice things, collect things, and think about things”
Second category of data analysis is: Quantitative analysis

It is the process of analyzing numerical data which is often include descriptive statistics like standard deviation.
Quantitative analysis involves: statistical models, statistical significance, analysis variables and    analysis of relationships between variables.
What are the benefits of data Analysis:
The benefits of data analysis are somehow obvious.by looking any existing data, businesses can be improved their processes, they can identify problematic issues. With data analysis, businesses can make reliable improvements and accurate decisions.
Here is some of the data analysis’s benefits in few points:
-          Data analysis helps businesses identify performance problems that can solves by some sort of action.
-          It gives businesses better awareness concerning habits of positional customers.
-          Data analysis also leads to faster and better decisions by viewed data in a visual manner.


Wednesday, April 19, 2017

Future of Big Data

Future Of Big Data:


Most experts claim that larger volume of data is going to continue generating. The number of mobile devices and other IoT devices are increasing. In order to deal with the huge number of unexpected data and analyze it, new tools are needed to do so. The paramount thing to win in big data market is having vision into big data to make decisions in real time.

According to Gartner, “machine learning is a top trend for 2016. Machine learning is the key element for data preparation and predictive analysis in the businesses of tomorrow”

Creating a link between data analytics and cognitive computing is going to be the following step in Big data.  Indeed, today's companies and organizations agree that there is a deep connection between big data and analytics. Manual analysis might be unprofitable and impracticable due to the increasing amount of data source. (Deep Neutral Networks) DNNs which is an artificial Neutral Networks that " interpret sensory data through a kind of machine labeling, perception raw input"

Businesses are going to use their data to pay value and revenue. Companies that use accurate data are going to generate about $430 billion in output benefits over than other companies that not using data.

Privacy is a crucial challenge that big data face it. The European Union put a new privacy regulation which is forces companies to address their privacy procedures. By 2018, 50% of the business ethics violations are going to relate to data.

To sum up, Big data are going to be bigger , and the most important thing is the companies that ignore data are threaten to reduce their productivity benefits and revenues.


Status of Big Data


Status and future of Big Data in an industry:
How organizations and companies using data and converting it to actions, intelligent decisions and valuable operations?
By processing and mining big data, organizations are using petabytes of information to gain insights into efficacy of supply chain, customer behavior and other part of business performance.
How is big data different?
By using internet, data is generated through new source. Also, big data is produced automatically by machines for example, sensor embedded in an engine. Moreover, not all of data is valuable, so it need to be focused on important parts of data.

Big data at some big companies:

According toDanial Price Google is the largest big data company in the world. It operates 3.5 billion requests per day and it is estimated that google stores over10 exabytes of data (10 billion gigabytes) while Facebook alone has 2.5 billion pieces of content, 2.7 billion ‘likes’ and 300 million photos – all of which adds up to more than 500 terabytes of data. Amazon extracts data from over 150 million customer’s purchases to assist users choose on items to purchase.
Amazon use massive amount of historical purchasing data to make accurate forecasts for shopping needs. In fact, Amazon estimated to have around 1 exabyte of data stored.
Target has focused attention on observing customers buying histories, assess income, estimate ages and marital statuses in order to predict potential buying patterns.
Types of tools using in big data:
Big data infrastructure deal with some software such as:
Hadoop: it is a software for data-intensive distributed applications based in the MapReduce programming model and Hadoop Distributed file system which is distributed file system.
According to Wei Fan and Albert Bifet () “Hadoop allows writing applications that rapidly process
large amounts of data in parallel on large clusters of compute nodes, a MapReduce job divides the
input dataset into independent subsets that are processed by map tasks in parallel.”
Processing big data:
integrating disparate data stores by mapping data to the programming framework and then data connecting and extracting from storage. After that, data need to be transforming for processing. Finally, preparing data for Hadoop MapReduce by subdividing data.

Briefly, there are three stages: Map stage, Shuffle stage and Reduce stage
In Map stage, the input data stores in Hadoop file system (HDFS) in form of file or directory.
In Shuffle and Reduce stage, it operates the data that comes from map stage and generate new output which also stores in HDFS.


Introduction of Big Data


Introduction of Big Data:


Big data, is it really big? Do we really need it in our lives or work? is it valuable? These are some questions pops in our minds when we think about big data. Nowadays, our lives surrounding by a lot of digital data, which we can collect, explore, and analyze.
By increasing rang of technologies and techniques big data has been known. Big Data is a term refers to a huge number of unstructured and structured data. Basically, it is combination of datasets, which is because of their massive size and complexity, are difficult to store, manage, and query, that make it very difficult to operate and analyze by using traditional database and software techniques. Having big data requires different approaches such as, tools, teachings and architecture. big data creates value from the storage data and operating very large quantities of information.
Sources of big data:
There are Three characteristics of Big Data:
           Volume: (quantity of data) Today, Facebook ingests 500 terabytes of new data every day.
           Velocity: (the speed of data processing) machine to machine operations exchange data between billions of devices.
           Variety: (types of data) big data includes, audios, videos, pdfs and words files etc.
Characteristics of data can be analyze by applying three steps: First, selecting the source of data for analyze. Second, remove the redundant data, and finally, Establishing NoSQL role which is database provide a technique for storing retrieval data in a mechanism way.
by captured, arrange, stored, manipulate, and analyzed that data, it helps companies and organizations to improve their operations and make faster, more bright decisions. It increases their income, get new customers or retained customers.


Tuesday, April 11, 2017

The Role of ERP system in Supply chain

The Role of ERP system in Supply chain

ERP (Enterprise Resource Planning) is a business process management that companies or

manufactures integrate and manage the significant parts of its business, such as planning, purchasing,

inventory, sales and marketing. Implementing ERP management software system can improve

efficiencies by decreasing the need of manually enter information and delete repetitive processes.

Also, Integrated Information is when all the information from different part of the business is in one

data base so the data will be updating regularly. Moreover, sales and customer service departments

can contact directly with customers to improve the relationships with them(Beal,V.enterprise

resource planning ) Due to the complexity that supply chain management have, and the importance of

supply chain management in the businesses, some big companies tent to use an advanced analysis to

transform historical data in every part of their supply chain through applying ERP system in their

business, in order to enhance forecasts, planning, productions and distributions. The main roles of

ERP are to prevent efficiency and reducing waste.


To sum up, supply chain is one of the most important parts the business, yet it is essential to company success and customer satisfaction.


Supply Chain Analysis

Supply Chain Analysis


Supply chain is a network of organizations, activities, people and resources which

contribute in creating and selling products .It starts with moving raw materials and components from

suppliers to manufacturer and finally to the customers (Rouse,M. supply chain).However in

(Myerson,P.Supply Chain Analytics ) article , depending on this method becomes more challenging

because of the latest effects of economics which cause the decries in suppliers, high cost of fuel, and

also the high customers predictions through the shifts in pricing. Moreover, the competition is

increasing as Myerson Sayed “low-cost outsources” which lead to the waste of time and money;

therefore, data analysis should be applied.  Simply, data analysis is a discipline that help to test the

raw data and build outcomes of information. In order to give the ability to vision the future and make

better decisions to the decision makers in business, some companies and industries use data analysis

specially to improve forecasting and operations planning .


Mapping the chain by using a flow chart to get a general review of the chain, the product flow, the

interaction between each part of the chain .


Also, the economic accounts corresponding to the activities of the agents involved in the chain. This contains of measuring the quantity that observed in their flow of material in physical and in financial terms. As a result, analysts will have the ability to estimate the relative importance or different parts of the chain which lead to an appropriate use of time and resources.


Monday, April 10, 2017

Data Visualization and Reporting

Data Visualization and Reporting
To simplify complex stories and ideas, some Analysts or reporters tend to explain and make repots in different formats. Converting data to graphical or pictorial format is a simple definition of data visualization. One of the aim of visualize data is to analyze the data and make it meaningful. In fact, Data carries a lot of information that could takes time to read and understand especially statistics information. Visualize data’s job is to make the raw information easy to read, understand, and gives the users the summaries of the reports. There are various formats to visualize data, such as bar chart, pie chart, flow/process chart, line graph etc. (Few,Perceptual Edge-Selecting the Right Graph for Your Message). (According to Tuft's presentation ) the perfect statistical graphs are results of sophisticated thoughts that display in accurate, clarity and effectively way. As a result, visualizing data should be a better replace of written data. In addition, graphs should represent a lot of numbers in a small space in the report. Also, graphs prevent confusing the reader by clarifying the ideas and numbers. In addition, the reader can easily compare between pieces of data. As in (Gentile, B. The Top 5 Business Benefits of Using Data Visualization) blog, there are many benefits in using data visualization such as in helping readers to comprehend the invisible data easily. By visualizing data in Maps, graphs or charts users can take in a lot of information in effective and efficient way. Data visualization illustrate many valuable information; for example, a heat map can show the most and least selling products, so business leader can go through that data and identify the reasons which effect on the sales. Decision makers can observe the changing in marketing environment and customers' behavior among huge amount of data. Thus, data visualization is a successful method because it can help to improve sales and test the customer needs.

·        Brief history of data visualization
It might be prevalent that data visualization and statistical graphs are modern approaches. Indeed, they have been existed from ancient times (Friendly, M. A Brief History of Data Visualization ).
In 6200 b.C. the oldest map was found in the region of Kirkuk, Iraq which is the description of a city in Babylon.
                                                                Figure1: the oldest map
In the 2nd century, Egypt created a table to arrange astronomical information to use as a navigation. The table is basically represented set of rows and columns which organize written data. In addition, tables are considered as a type of charts (Few, S. Data Visualization Past, Present, and Future)
(According to Friendly) up to the 17th century, data visualization expanded to use new tools with accurate format in representing data.  For example, timeline was uses to display the life of some famous people in 1765.
                                                                 Figure 2: Timeline
In 18th century, modern graphs took place. Most of modern forms of graphs and charts that known today were improvement from that century such as pie charts, weather maps and geological map.
Representing data in advanced statistical graphs and drawing charts become more recognizable during the 19th century which is as Friendly says “ the modern age of statistical graphs” (Friendly, M Milestones in the History of Data Visualization).
·        Modern approaches of data visualization
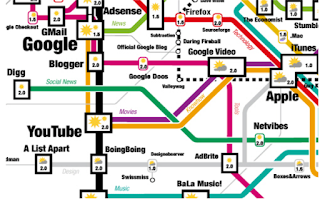
There are several ways to visualize data such as histograms, geographical map etc. On the hand, there are modern methods like mind map which represent for example the most well-known websites, and it shows the most popularity, succeed website Also, Mind maps shoes how are these websites connected to each other (Friedman, V. Data Visualization: Modern Approaches ).

     Figure3: Mind Map of the most popular websites

All in all, reporting data and visualizing it are existing to clarify and simplify the complicated stories. It has been there before the common era and it has been developed through centuries.


Fashion Industry and Big Data

In this post and the next two posts, I am going to write about big data and how fashion industry leverages it. In social media era, peopl...